


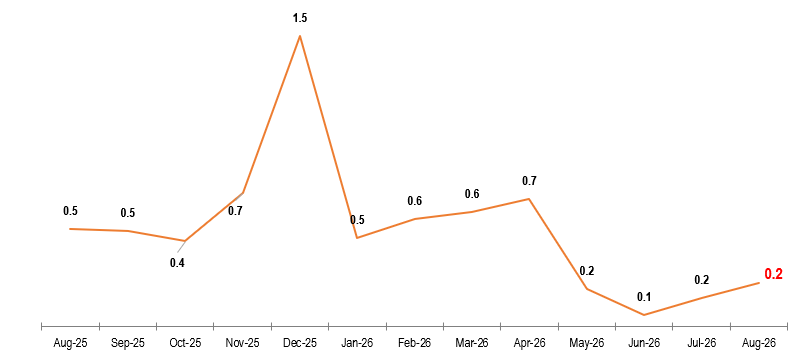
The overall monthly inflation rate for August 2026 was recorded at 0.2 percent the same as that recorded in July 2026. This outturn was mainly attributed to price movements in selected food and non-food items
.
Overall Monthly Inflation, August 2025 – August 2026

Monthly Inflation Rates for Food and Non-Food Items
Monthly food inflation for August 2026 increased to 0.2 percent from 0.1 percent recorded in July 2026. This indicates that, on average food prices increased by 0.2 percent between July 2026 and August 2026. The increase in the monthly food inflation was mainly attributed to price movements in Fruits (Lemons, Bananas, Water Melon, Avocadoes); Vegetables (Cassava Leaves, Okra, Cucumber, impwa, Green pepper, Pumpkin, Maize Cobs ); Fresh milk and Eggs.
Monthly non-food inflation for August 2026 was recorded at 0.2 percent, compared with 0.3 percent recorded in July 2026. This indicates that on average prices of non-food items increased by 0.2 percent between July 2026 and August 2026. This outturn was mainly attributed to price movements in prices of non-food items such, Phamarceuticles Products (Ampicillin, Cafenol, Aspirin, No cough, Magnesium Trisilicate, Throat lozenges, Eye ointment, Oral contraceptives); Fuels and lubricants (Diesel, Petrol, Engine oil); General service, Repair Charges and Wheel Balancing.
Overall Monthly Inflation Rate for Food and Non-Food Items, August 2025 – August 2026 (%)
| Weight: | Aug – 2025 | Sep – 2025 | Oct – 2025 | Nov – 2025 | Dec – 2025 | Jan – 2026 | Feb- 2026 | Mar- 2026 | Apr- 2026 | May- 2026 | Jun- 2026 | Jul- 2026 | Aug- 2026 |
Total | 1,000.00 | 0.5 | 0.5 | 0.4 | 0.7 | 1.5 | 0.5 | 0.6 | 0.6 | 0.7 | 0.2 | 0.1 | 0.2 | 0.2 |
Food | 534.85 | 0.6 | 0.5 | 0.4 | 0.8 | 0.6 | 0.9 | 0.9 | 0.7 | 0.3 | 0.3 | 0.2 | 0.1 | 0.2 |
Non- Food | 465.15 | 0.4 | 0.5 | 0.5 | 0.6 | 3.0 | -0.3 | 0.0 | 0.4 | 1.3 | 0.1 | -0.2 | 0.3 | 0.2 |