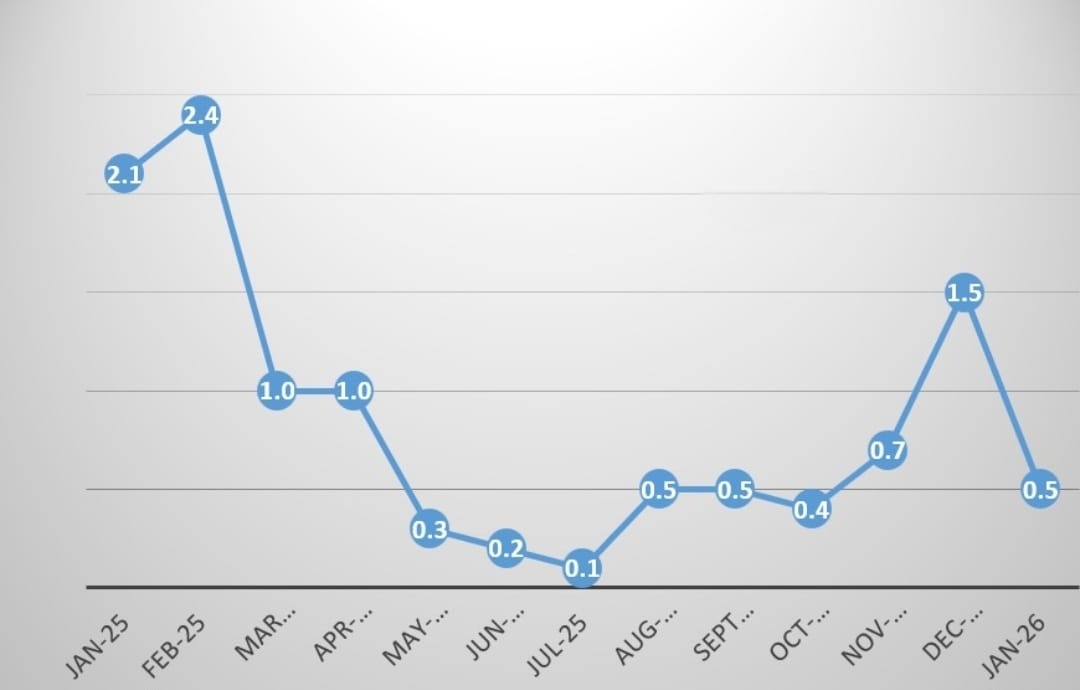
The overall monthly inflation rate for January 2026 was recorded at 0.5 percent compared with 1.5 percent recorded in December, 2025. This outturn was attributed to price movements in selected non- food items
.
Overall Monthly Inflation, January 2025-January 2026
Monthly Inflation Rates for Food and Non-Food Items
Monthly food inflation for January 2026 was recorded at 0.9 percent, compared with 0.6 percent in December 2025. This indicates that, on average, food prices increased by 0.9 percent between December 2025 and January 2026. The increase was mainly attributed to price movements of Cereal (Breakfast Mealie Meal, Roller Mealie Meal, Maize grain, Rice Local) Meat (Brisket, T-bone, Mixed cut, Beef Sausages, Mince Meat, Ox-liver, Offals, Plain Pork Sausages, Goat Meat); and Eggs.
Monthly non-food inflation for January 2026 was recorded at -0.3 percent, compared with 3.0 percent in December 2025. The decrease was mainly attributed to price movements in Fuel and lubricants (diesel, engine oils and Lubricants (brake fluids)); Passenger transport by air (Air Fare Domestic, Air Fare Regional, Lusaka/London via Dubai) ; and Purchase of Motor Vehicles.
.
Overall Monthly Inflation Rate for Food and Non-Food Items, December 2024 – December 2025 (%)
| Weight: | Jan – 2025 | Feb – 2025 | Mar – 2025 | Apr– 2025 | May– 2024 | Jun – 2025 | Jul – 2025 | Aug – 2025 | Sep – 2025 | Oct – 2025 | Nov – 2025 | Dec – 2025 | Jan – 2025 |
Total | 1,000.00 | 2.1 | 2.4 | 1.0 | 1.0 | 0.3 | 0.2 | 0.1 | 0.5 | 0.5 | 0.4 | 0.7 | 1.5 | 0.5 |
Food | 534.85 | 2.8 | 3.4 | 1.0 | 0.8 | 0.6 | 0.4 | 0.3 | 0.6 | 0.5 | 0.4 | 0.8 | 0.6 | 0.9 |
Non- Food | 465.15 | 1.0 | 0.8 | 1.0 | 1.2 | 0.0 | -0.2 | -0.3 | 0.4 | 0.5 | 0.5 | 0.6 | 3.0 | -0.3 |
Read more>>Vol 274 of 2026 The Monthly Januaryr.