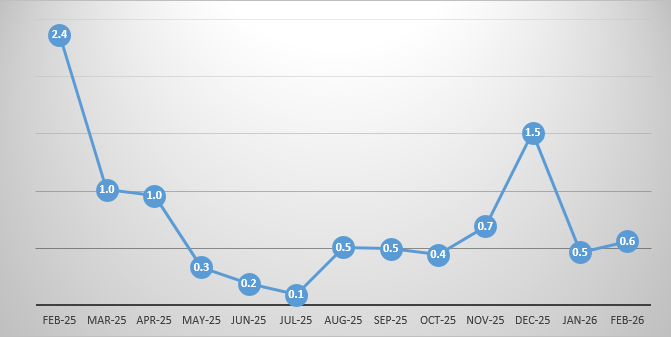
The overall monthly inflation rate for February 2026 was recorded at 0.6 percent compared with 0.5 percent recorded in January, 2025. This outturn was attributed to price movements in selected food items
.
Overall Monthly Inflation, February 2025 – February 2026
Monthly Inflation Rates for Food and Non-Food Items
Monthly food inflation for February 2026 remained at 0.9 percent the same as that recorded in January, 2026. This indicates that, on average, food prices increased by 0.9 percent between January 2026 and February 2026. The increase was mainly attributed to price movements of Cereal (Breakfast Mealie Meal, Roller Mealie Meal, Maize grain, Rice Local); Fish ( Buka Buka, Fresh Kapenta, Dried Bream-Medium Sized-Opened, Dried Kapenta Mpulungu, Dried Kapenta Siavonga) Meat ( Fillet steak, T-bone, Mixed cut, Beef Sausages, Plain Pork Sausages, Goat Meat); and Eggs.
Monthly non-food inflation for February 2026 was recorded at 0.0 percent, compared with -0.3 percent in January 2026. This indicates that non-food prices on average remained unchanged between January 2026 and February 2026.
Overall Monthly Inflation Rate for Food and Non-Food Items, December 2024 – December 2025 (%)Read
| Weight: | Feb – 2025 | Mar – 2025 | Apr– 2025 | May– 2024 | Jun – 2025 | Jul – 2025 | Aug – 2025 | Sep – 2025 | Oct – 2025 | Nov – 2025 | Dec – 2025 | Jan – 2025 | Feb- 2025 |
Total | 1,000.00 | 2.4 | 1.0 | 1.0 | 0.3 | 0.2 | 0.1 | 0.5 | 0.5 | 0.4 | 0.7 | 1.5 | 0.5 | 0.6 |
Food | 534.85 | 3.4 | 1.0 | 0.8 | 0.6 | 0.4 | 0.3 | 0.6 | 0.5 | 0.4 | 0.8 | 0.6 | 0.9 | 0.9 |
Non- Food | 465.15 | 0.8 | 1.0 | 1.2 | 0.0 | -0.2 | -0.3 | 0.4 | 0.5 | 0.5 | 0.6 | 3.0 | -0.3 | 0.0 |