The overall monthly inflation for March 2025 was recorded at 1.0 percent compared with 2.4 percent recorded in the previous month. This outturn was mainly attributed to price movements in food items (see Figure 4).
Figure 4: Overall Monthly Inflation, March 2024 – March 2025
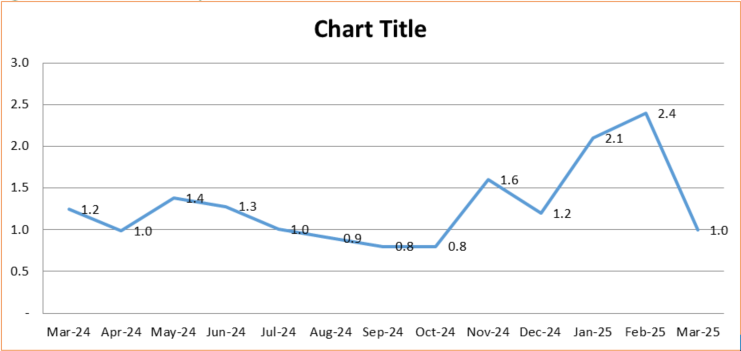
Source: ZamStats, 2025
Monthly Inflation Rates for Food and Non-Food Items
Monthly food inflation rate for March 2025 was recorded at 1.0 percent compared with the 3.4 percent recorded in February, 2025. This means on average prices of goods and services increased by 1.0 percent between February 2025 and March 2025. This development was mainly attributed to general price movements of Bread and cereals (Maize grain, Rice imported); Fish(Dried Bream-Medium Sized Opened, Dried Kapenta Mpulungu, Dried Kapenta Siavonga, Dried Kapenta Chisense);Fruit(Oranges, lemon, Water Melon, Avocadoes) and Vegetables (Lumanda, Cassava leaves, Impwa, Pumpkin, Carrots, Sweet potatoes, Chikanda tubers).
Monthly non-food inflation rate for March 2025 was recorded at 1.0 percent compared
with 0.8 percent recorded in February 2024. This outturn was mainly attributed to price
movements in prices of non-food items such as Footwear ( Ladies leather shoes, Ladies
synthetic shoes, Boys and girls school shoes); Furniture (Bed and mattress, Wooden bed
frame, Lounge suit, Coffee table); Major household appliances (Refrigerator, Washing machine, Stove); Purchase of vehicles; Accomodation services(Single room 3 & 5 star,Bed and Continental Breakfast, Bed (Single room in guest house));Iron sheets and charcoal.
Table 9: Overall Monthly Inflation Rate for Food and Non-Food Items, March 2024- March 2025 (%)
| Weight: | Mar – 2024 | Apr – 2024 | May – 2024 | Jun – 2024 | Jul – 2024 | Aug – 2024 | Sep – 2024 | Oct – 2024 | Nov – 2024 | Dec – 2024 | Jan – 2025 | Feb – 2025 | Mar – 2025 |
Total | 1,000.00 | 1.2 | 1.0 | 1.4 | 1.3 | 1.0 | 0.9 | 0.8 | 0.8 | 1.6 | 1.2 | 2.1 | 2.4 | 1.0 |
Food | 534.85 | 2.4 | 1.0 | 1.3 | 1.5 | 1.5 | 1.0 | 0.8 | 0.9 | 0.9 | 1.4 | 2.8 | 3.4 | 1.0 |
Non- Food | 465.15 | (0.3) | 1.0 | 1.5 | 1.0 | 0.3 | 0.7 | 0.8 | 0.8 | 2.6 | 0.9 | 1.0 | 0.8 | 1.0 |
Source: ZamStats, 2025