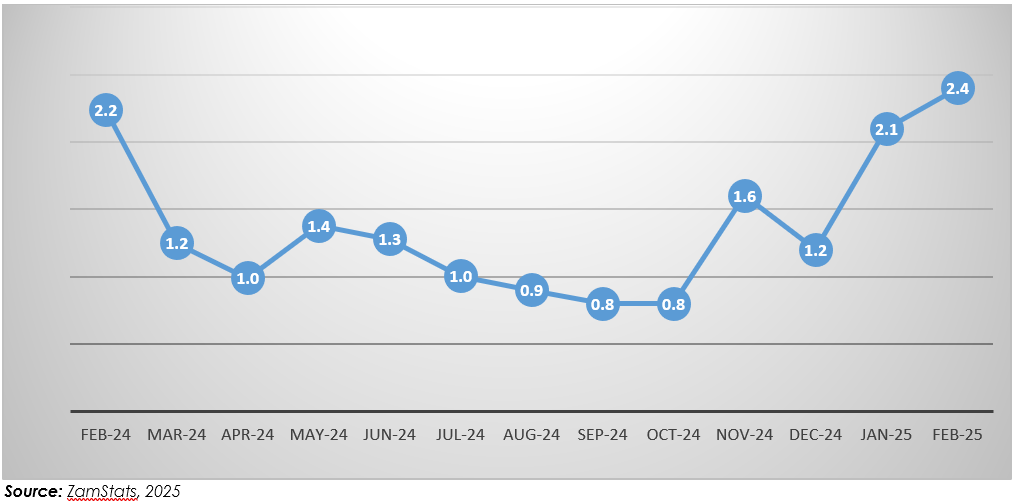
The overall monthly inflation for February 2025 was recorded at 2.4 percent compared with 2.1 percent recorded in the previous month. This outturn was mainly attributed to price movements in food items (see Figure 3).
Figure 3: Overall Monthly Inflation, February 2024- February 2025
Monthly Inflation Rates for Food and Non-Food Items
Monthly food inflation rate for February 2025 was recorded at 3.4 percent Compared with the 2.8 percent recorded in January, 2025. This means on average prices of goods and services increased by 3.4 percent between January 2025 and February 2025. This development was mainly attributed to general price movements of Bread and Cereal (Maize Grain, Rice Local, Bread, Wheat Plain Household Flour, Bread Flour Imported) Meat (Fillet Steak, Rump Steak, Brisket, Mixed Cut T-bone, Beef Sausage, Pork Chops, Goat Meat, Frozen Chicken); Fish (Frozen Fish, Buka Buka, Dried Bream-Medium Sized-Opened, Dried Kapenta Siavonga, Dried Kapenta Chisense); Peanut butter and Cooking oil.
Monthly non-food inflation rate for February 2025 was recorded at 0.8 percent compared with 1.0 percent recorded in January 2024. This outturn was mainly attributed to price movements in prices of non-food items such as Household appliances(Refrigerator, Stove/cooker, Microwave oven); Phamarceuticles Products (Medix cough syrup, No cough, Kaolin/Anti Diarrhoea, Andrews liver salt, Magnesium Trisilicate, Fansider, Tetracycline, Asthma Cure (Salbutamol),Throat lozenges); Passenger transport by air (Air Fare Domestic, Air Fare Regional, Lusaka/London via Dubai);Dining Suite, Carpets and Ironing board.
Table 5: Overall Monthly Inflation Rate for Food and Non-Food Items, February 2024- February 2025 (%)
| Weight: | Feb – 2024 | Mar – 2024 | Apr – 2024 | May – 2024 | Jun – 2024 | Jul – 2024 | Aug – 2024 | Sep – 2024 | Oct – 2024 | Nov – 2024 | Dec – 2024 | Jan – 2025 | Feb – 2025 |
Total | 1,000.00 | 2.2 | 1.2 | 1.0 | 1.4 | 1.3 | 1.0 | 0.9 | 0.8 | 0.8 | 1.6 | 1.2 | 2.1 | 2.4 |
Food | 534.85 | 2.3 | 2.4 | 1.0 | 1.3 | 1.5 | 1.5 | 1.0 | 0.8 | 0.9 | 0.9 | 1.4 | 2.8 | 3.4 |
Non- Food | 465.15 | 2.2 | (0.3) | 1.0 | 1.5 | 1.0 | 0.3 | 0.7 | 0.8 | 0.8 | 2.6 | 0.9 | 1.0 | 0.8 |
Source: ZamStats, 2025