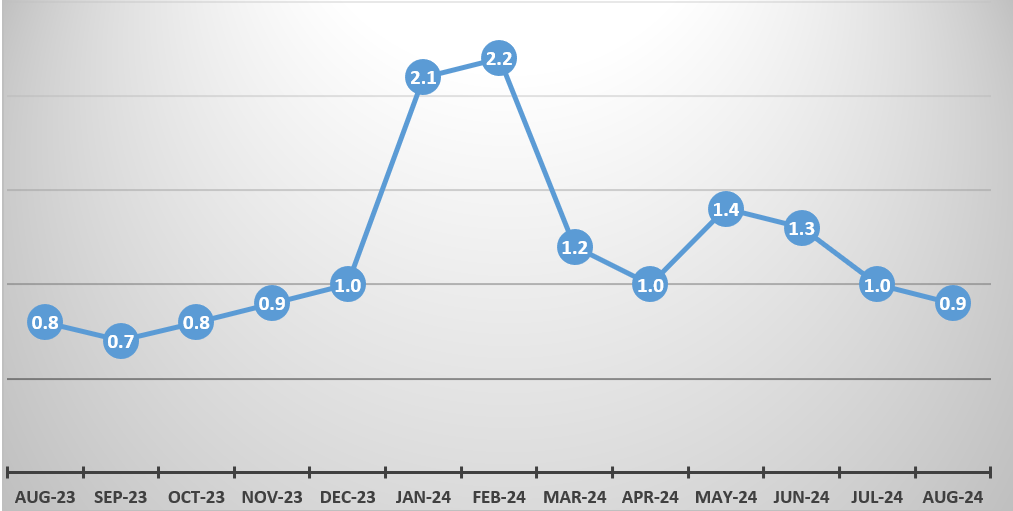
The overall monthly inflation for August 2024 was recorded at 0.9 percent from 1.0 percent recorded in the previous month. This outturn was mainly attributed to price movements in selected food items (see Figure 3).
Figure 3: Overall Monthly Inflation, August 2023- August 2024
Monthly Inflation Rates for Food and Non-Food Items
Monthly food inflation rate for August 2024 was recorded at 1.0 percent compared with 1.5 percent recorded in July, 2024.This means on average prices of goods and services increased by 1.0 percent between July 2024 and August 2024. This development was mainly attributed to general price movements of Meat (Brisket, Beef sausage, Pork chops, Kidneys, Chicken) and Vegetables (Pumpkin leaves, Chinese cabbage, Cabbage, Tomatoes, Impwa, Maize cob, Onion, Dried beans).
Monthly non-food inflation rate for August 2024 was recorded at 0.7 percent compared with 0.3 percent recorded in July 2024. This means on average prices of non-food items increased by 0.7
percent between July 2024 and August 2024. This was mainly attributed to increases in non-food items such as Fuels ( Diesel & Petrol) and Hammer milling services.
Table 5: Overall Monthly Inflation Rate for Food and Non-Food Items, August 2023- August 2024 (%)
| Weight: | Aug – 2023 | Sep – 2023 | Oct – 2023 | Nov – 2023 | Dec – 2023 | Jan – 2024 | Feb – 2024 | Mar – 2024 | Apr – 2024 | May – 2024 | Jun – 2024 | Jul – 2024 | Aug – 2024 |
Total | 1,000.00 | 0.8 | 0.7 | 0.8 | 0.9 | 1.0 | 2.1 | 2.2 | 1.2 | 1.0 | 1.4 | 1.3 | 1.0 | 0.9 |
Food | 534.85 | 0.8 | 0.5 | 0.7 | 0.9 | 1.0 | 2.3 | 2.3 | 2.4 | 1.0 | 1.3 | 1.5 | 1.5 | 1.0 |
Non- Food | 465.15 | 0.8 | 0.9 | 0.9 | 0.9 | 0.9 | 1.9 | 2.2 | -0.3 | 1.0 | 1.5 | 1.0 | 0.3 | 0.7 |