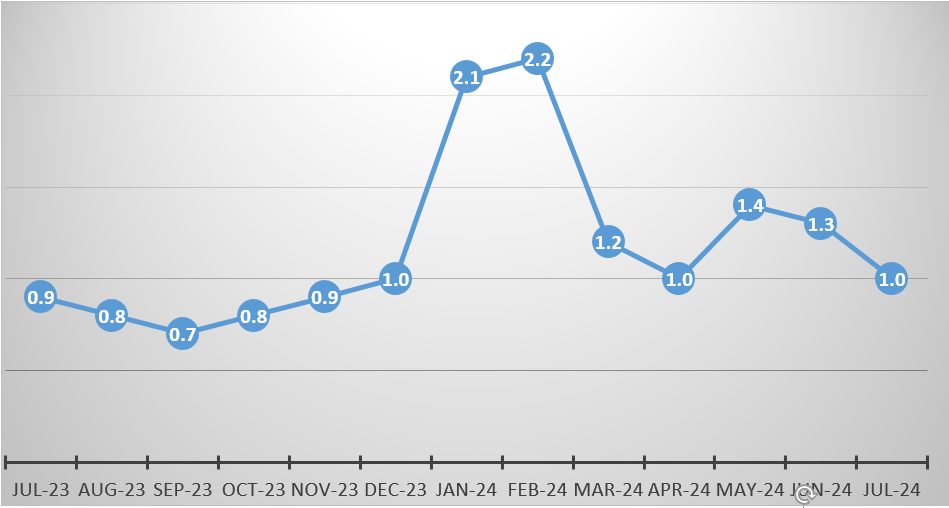
The overall monthly inflation for July 2024 was recorded at 1.0 percent from 1.3 percent recorded in the previous month. This outturn was mainly attributed to price movements in selected nonfood items (see Figure 3).
Monthly food inflation rate for July 2024 was recorded at 1.5 percent same as 1.5 percent recorded in June, 2024.This means on average prices of goods and services increased by 1.5 percent between June 2024 and July 2024. This development was mainly attributed to general price movements of Bread and Cereals (Breakfast & Roller Mealie Meal, Rice,bread ,Bun, Friters, Bun, Cassava meal); Meat (Rump steak, Brisket, Mixed cut, T-bone, Offals) Fish (Frozen Fish, Buka Buka, Fresh Kapenta, Dried Kapenta Mpulungu); Milk (Fresh Milk, Fresh Milk Super Milk, Condensed Milk, Sour milk); Fruit (Oranges, Lemons, Bananas, Apples, Avocados, Groundnuts); Eggs and Cooking oil.
Monthly non-food inflation rate for July 2024 was recorded at 0.3 percent compared with 1.0 percent recorded in June 2024. This means on average prices of non-food items increased by 0.3 percent between June 2024 and July 2024. This was mainly attributed to decreases in nonfood items such as Major Household Appliances ( Refrigerator, Washing Machine, Microwave
Oven) Fuels ( Diesel, Petrol); 3 piece lounge suit, Repair Charges and Passenger transport by air.
| Weight: | July – 2023 | Aug – 2023 | Sep – 2023 | Oct – 2023 | Nov – 2023 | Dec – 2023 | Jan – 2024 | Feb – 2024 | Mar – 2024 | Apr – 2024 | May – 2024 | Jun – 2024 | Jul – 2024 |
Total | 1,000.00 | 0.9 | 0.8 | 0.7 | 0.8 | 0.9 | 1.0 | 2.1 | 2.2 | 1.2 | 1.0 | 1.4 | 1.3 | 1.0 |
Food | 534.85 | 1.0 | 0.8 | 0.5 | 0.7 | 0.9 | 1.0 | 2.3 | 2.3 | 2.4 | 1.0 | 1.3 | 1.5 | 1.5 |
Non- Food | 465.15 | 0.7 | 0.8 | 0.9 | 0.9 | 0.9 | 0.9 | 1.9 | 2.2 | -0.3 | 1.0 | 1.5 | 1.0 | 0.3 |
Read more>>Vol 256 of 2024 The Monthly July