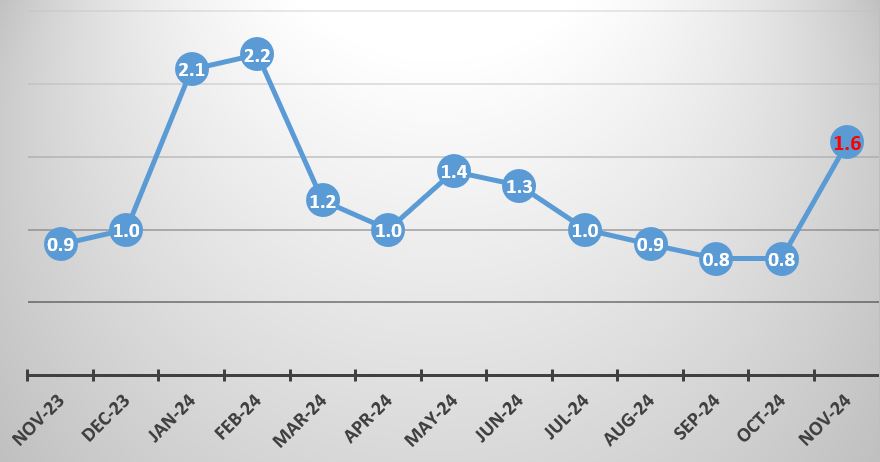
The overall monthly inflation for November 2024 was recorded at 1.6 percent compared with 0.8 percent recorded in the previous month. This outturn was mainly attributed to price movements in selected non-food items (see Figure 3).
Figure 3: Overall Monthly Inflation, November 2023- November 2024
Monthly Inflation Rates for Food and Non-Food Items
Monthly food inflation rate for November 2024 was recorded at 0.9 percent same as 0.9 percent recorded in October, 2024.This means on average prices of goods and services increased by 0.9
percent between October 2024 and November 2024. This development was mainly attributed to general price movements of Bread and Cereal (Maize Grain, Rice Local, Rice Imported, Bread, Wheat Plain Household Flour, Bread Flour Imported) Meat (Fillet Steak, Rump Steak, Brisket, Mixed Cut T-bone, Beef Sausage, Pork Chops, Goat Meat, Chicken) Fruits (Oranges, Lemons, Apples, Pawpaw, Water Melon, Avocadoes).
Monthly non-food inflation rate for November 2024 was recorded at 2.6 percent compared with 0.8 percent recorded in October 2024. This means on average prices of non-food items increased by 2.6 percent between October 2024 and November 2024. This was mainly attributed to increases in non-food items such as Purchase of Motor Vehicles (Toyota Hilux, Toyota corolla, Nissan ALMERA 1.5 L Acenta MT, Nissan Pick (Nissan Hard body); Pharmaceutical Products (Andrews liver salt, Magnesium Trisilicate, Eye ointment (Tetracycline), No cough, Syringes, Fancider) and Electricity; Accommodation services (Single room 3 & 5-star, Bed and Continental Breakfast, Bed (Single room in guest house)); Passenger transport by air and Diesel.
Table 5: Overall Monthly Inflation Rate for Food and Non-Food Items, November 2023- November 2024 (%)
| Weight: | Nov – 2023 | Dec – 2023 | Jan – 2024 | Feb – 2024 | Mar – 2024 | Apr – 2024 | May – 2024 | Jun – 2024 | Jul – 2024 | Aug – 2024 | Sep – 2024 | Oct – 2024 | Nov – 2024 |
Total | 1,000.00 | 0.9 | 1.0 | 2.1 | 2.2 | 1.2 | 1.0 | 1.4 | 1.3 | 1.0 | 0.9 | 0.8 | 0.8 | 1.6 |
Food | 534.85 | 0.9 | 1.0 | 2.3 | 2.3 | 2.4 | 1.0 | 1.3 | 1.5 | 1.5 | 1.0 | 0.8 | 0.9 | 0.9 |
Non- Food | 465.15 | 0.9 | 0.9 | 0.9 | 1.9 | 2.2 | -0.3 | 1.0 | 1.5 | 1.0 | 0.3 | 0.8 | 0.8 | 2.6 |
Source: ZamStats, 2024