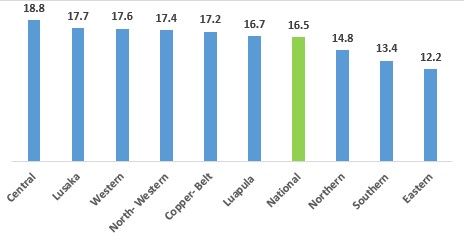
A disaggregation of the annual inflation by province shows that annual inflation during the month under review increased for ; Luapula (16.7% from 16.6% ); Lusaka province at (17.7% from 17.2%); Northern (14.8% from 14.2% ); North-western (17.4% from 17.0%) and Western Provinces (17.6% from 15.1%). Annual inflation decreased for Copperbelt (17.2% from 18.1%); Eastern (12.2% from 13.4%) and Southern Provinces(13.4% from 14.2% ). Annual inflation remained the same for Central Province at 18.8%. (see Table 3).
Table 3: Provincial Annual Inflation Rates, April 2024 – April 2025 (%)
| Central | Copperbelt | Eastern | Luapula | Lusaka | Northern | North- Western | Southern | Western |
Weight | 107.19 | 219.68 | 88.98 | 50.60 | 283.89 | 65.72 | 32.33 | 109.19 | 42.42 |
Apr-24 | 17.2 | 13.9 | 13.8 | 12.9 | 12.0 | 9.1 | 12.2 | 16.2 | 22.5 |
May-24 | 18.4 | 14.7 | 14.8 | 12.9 | 13.9 | 9.2 | 12.5 | 16.6 | 20.1 |
Jun-24 | 18.3 | 16.4 | 15.3 | 14.3 | 13.7 | 10.3 | 12.4 | 17.0 | 20.1 |
Jul-24 | 20.5 | 16.0 | 15.2 | 15.2 | 12.9 | 11.5 | 15.0 | 18.0 | 17.5 |
Aug-24 | 20.5 | 15.9 | 15.6 | 14.9 | 13.4 | 11.5 | 15.1 | 17.5 | 17.6 |
Sep-24 | 21.0 | 15.9 | 15.3 | 14.9 | 13.9 | 12.2 | 13.8 | 17.0 | 17.5 |
Oct-24 | 21.2 | 15.3 | 17.0 | 15.8 | 13.9 | 11.7 | 13.9 | 17.3 | 18.1 |
Nov-24 | 21.7 | 17.8 | 17.2 | 17.1 | 13.5 | 12.4 | 13.4 | 18.7 | 19.3 |
Dec-24 | 22.2 | 18.9 | 16.9 | 17.5 | 13.7 | 12.0 | 15.2 | 18.3 | 18.6 |
Jan-25 | 23.1 | 18.8 | 14.3 | 18.1 | 14.0 | 12.4 | 13.9 | 17.3 | 20.5 |
Feb-25 | 18.5 | 17.9 | 14.6 | 15.8 | 17.2 | 13.5 | 15.3 | 17.0 | 16.9 |
Mar-25 | 18.8 | 18.1 | 13.4 | 16.6 | 17.2 | 14.2 | 17.0 | 14.2 | 15.1 |
Apr-25 | 18.8 | 17.2 | 12.2 | 16.7 | 17.7 | 14.8 | 17.4 | 13.4 | 17.6 |
Source: ZamStats, 2025
Read more>>Vol 265 of 2025 The Monthly April