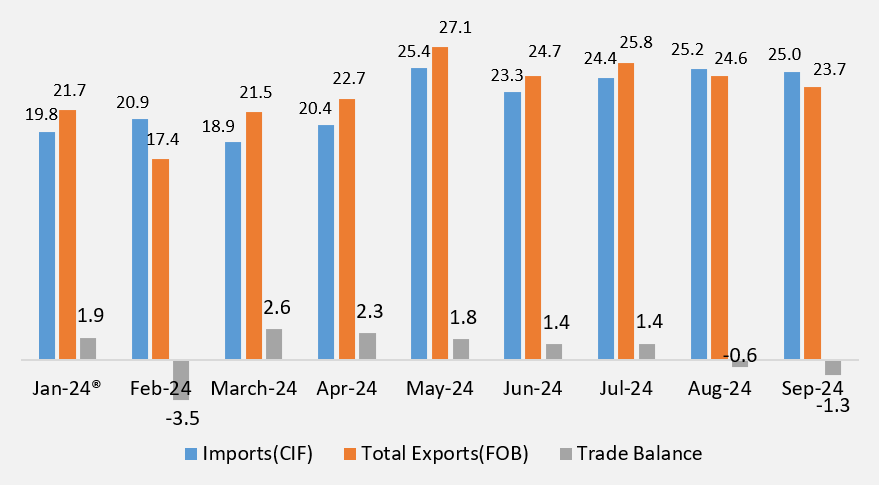
The country recorded a trade deficit of K1.3 billion in September 2024 compared to the deficit of K0.6 billion recorded in August 2024 (see Table10).
Exports mainly comprising domestically produced goods, decreased by 3.8 percent from 24.6 billion in August 2024 to 23.7 billion in September 2024. This was mainly on account of 4.0, 5.5, and 0.6 percent decreases in export earnings from Intermediate goods(Copper anodes), Consumer goods (Aerated Waters) and Raw materials (Nickel ores and concentrates) respectively.
Imports decreased by 0.9 percent from K25.2 billion in August 2024 to K25.0 billion in September 2024.This was mainly as a result of a 5.8 and 2.7 percent decreases in import bills of Intermediate goods (Ammonium dihydrogenorthophosphate) and Consumer goods (Gas oils.) respectively (see Table 2.2 in Annex).
Months | Imports | Domestic Exports | Total Exports | Trade Balance |
Jan-24® | 19.8 | 20.3 | 21.7 | 1.9 |
Feb-24® | 20.9 | 16.9 | 17.4 | -3.5 |
March-24® | 18.9 | 19.8 | 21.5 | 2.6 |
Quarter1® | 59.6 | 57.0 | 60.7 | 1.1 |
Apr-24 | 20.4 | 21.9 | 22.7 | 2.3 |
May-24 | 25.4 | 26.2 | 27.1 | 1.8 |
Jun-24 | 23.3 | 23.3 | 24.7 | 1.4 |
Quarter2 | 69.1 | 71.4 | 74.5 | 5.4 |
Jul-24 | 24.4 | 25.0 | 25.8 | 1.4 |
Aug-24 | 25.2 | 23.8 | 24.6 | -0.6 |
Sep-24* | 25.0 | 22.9 | 23.7 | -1.3 |
Quarter3 | 74.7 | 71.6 | 74.2 | -0.5 |
Total: | 203.4 | 200.0 | 209.3 | 5.9 |
Source: ZamStats, 2024
Note: These trade data are compiled based on the General Trade System
Domestic Exports-These are Commodities grown, produced or manufactured locally including commodities imported from foreign countries that have been significantly changed or enhanced in value. Re-Exports=Total Exports-Domestic Exports. (*) Provisional