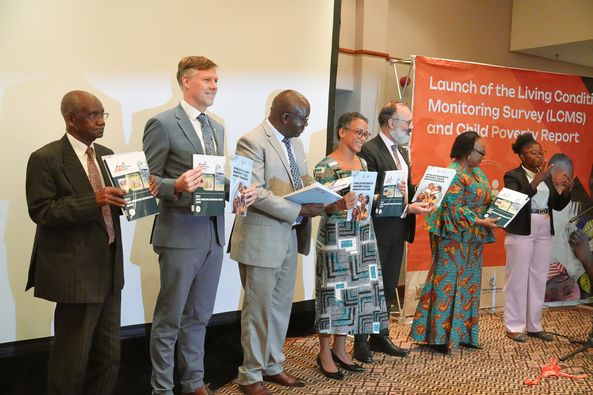
The world today is characterized by increasing and ever-changing demand for statistics of different frequency and, sustained development will mainly depend on the extent to which countries such as ours will use statistical evidence to make informed decisions at all levels be it government, non-government and individual. With this realization, the Zambia Statistics Agency (Zamstats) has continued to undertake this survey in an effort to meet the expectations of various data users including government. As a common adage goes “IF YOU CAN’T MEASURE IT, YOU CAN’T MANAGE IT”. We need to create a knowledge society whose decisions are based on strong statistical evidence rather than feelings, hearsay or perceptions. we need to go beyond recognising numbers but knowing what to do with the numbers.
Zambia Statistics Agency conducted the 2022 Living Conditions Monitoring Survey in June/July of the year 2022 and covered 8,470 households in 420 randomly selected Enumeration Areas (EAs) across the 10 provinces of Zambia. The survey estimated a total population of 19,610,769 million, with 60 percent of that residing in rural areas. The survey estimated a total of 3,861,557 households, with an average household size of 5.1 persons.
Survey results indicate 31.4 percent of population was economically active (in the labour force), while 68.6 percent was economically inactive. Analysis by sex shows that 34.8 percent of males and 28.4 percent of females were in the labour force. Results further show that unemployment rate was estimated at 13.1 percent. Females had a higher unemployment rate (14.9 percent) than their male counterparts at 11.5 percent. The agriculture, forestry and fishing industry had the highest proportion of employed persons at 37.2 percent. The water supply, sewerage, waste management industry, information and communication and extraterritorial organization and bodies had the least proportions of the less than 0.1 percent each. Monthly average income for households in rural areas was K2,112.2 while that of households in urban areas was K5,546.6.
The survey estimated that the top 10 percent of households earned 56 percent of total household incomes while the bottom 50 percent earned seven percent of the total household incomes. In rural areas, households spent 56.4 percent of their incomes on food and 43.6 percent on non-food expenditure items, while in urban areas expenditure on food amounted to 34.7 percent of household incomes and non-food expenditure amounted to 65.3 percent.
Survey results show that 60 percent of the population was living below the national poverty line at the time of the survey (78.8 percent in rural areas and 31.9 percent in urban areas). Further, the survey shows that 48.0 percent of the population were extremely poor. Overall results show that 588 out of every 1000 male-headed households compared to 634 out of every 1000 female-headed households were poor at national level. This implies that out of every 100 households, female-headed households were more likely to be poorer than households headed by their male counterparts.
Analysis by Residence shows that 63.0 percent of households in rural areas had access to safe water while 91.9 percent of households in urban areas had access to safe water. At provincial level, Lusaka Province had the highest percent of households with access to safe water at about 96.1 percent and Northern Province had the lowest percent of households with access to safe water at 39.9 percent. There was a decline in the proportion of households who treated or boiled their drinking water at national level from 24.7 percent to 21.7 percent.
About 33.8 percent of households in rural areas had connection to an electricity source while 66.2 percent were not connected. In urban areas 80.2 percent of households had connection to an electricity source while 19.7 percent were not connected At national level, 33.9 percent of households used electricity as a main source of lighting energy. This was followed by torch, used by 31.1 percent of the households. At national level, 49.3 percent of the households used collected firewood as the main source of cooking energy; followed by purchased charcoal with 35.8 percent and electricity.
