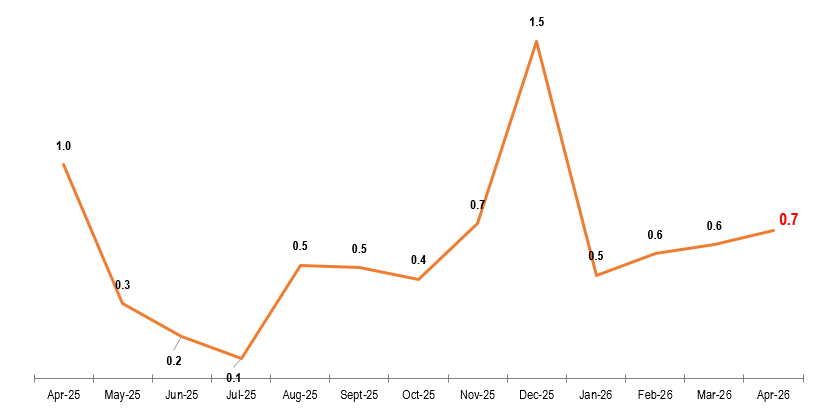
The overall monthly inflation rate for April 2026 was recorded at 0.7 percent from 0.6 percent recorded in the previous month. This outturn was mainly attributed to price movements in selected non – food items.
.
Overall Monthly Inflation, April 2025 – April 2026
Monthly Inflation Rates for Food and Non-Food Items
Monthly food inflation for April 2026 was recorded at 0.3 percent, down from 0.7 percent recorded in March, 2026. This indicates that, on average, food prices increased by 0.3 percent between March 2026 and April 2026. The decrease was mainly attributed to price movements in Cereals (Breakfast Mealie Meal, Roller Mealie Meal, Maize grain, Samp); Vegetables ( Spinach, Chinese Cabbage, Green Beans, Pumpkin, Dried Beans, Sweet Potatoes); Fish (Buka Buka, Fresh Kapenta, Dried Bream-Medium Sized-Opened, Dried Kapenta Mpulungu, Dried Kapenta Chisense); Cooking Oil and Eggs.
Monthly non-food inflation for April 2026 was recorded at 1.3 percent, compared with 0.4 percent recorded in March 2026. This indicates that on average prices of non-food items increased by 1.3 percent between April 2026 and March 2026.
Overall Monthly Inflation Rate for Food and Non-Food Items, December 2024 – December 2025 (%)
| Weight: | Apr– 2025 | May– 2024 | Jun – 2025 | Jul – 2025 | Aug – 2025 | Sep – 2025 | Oct – 2025 | Nov – 2025 | Dec – 2025 | Jan – 2025 | Feb- 2025 | Mar- 2025 | Apr- 2025 |
Total | 1,000.00 | 1.0 | 0.3 | 0.2 | 0.1 | 0.5 | 0.5 | 0.4 | 0.7 | 1.5 | 0.5 | 0.6 | 0.6 | 0.7 |
Food | 534.85 | 0.8 | 0.6 | 0.4 | 0.3 | 0.6 | 0.5 | 0.4 | 0.8 | 0.6 | 0.9 | 0.9 | 0.7 | 0.3 |
Non- Food | 465.15 | 1.2 | 0.0 | -0.2 | -0.3 | 0.4 | 0.5 | 0.5 | 0.6 | 3.0 | -0.3 | 0.0 | 0.4 | 1.3 |
more>>Vol 277 of 2026 The Monthly April.