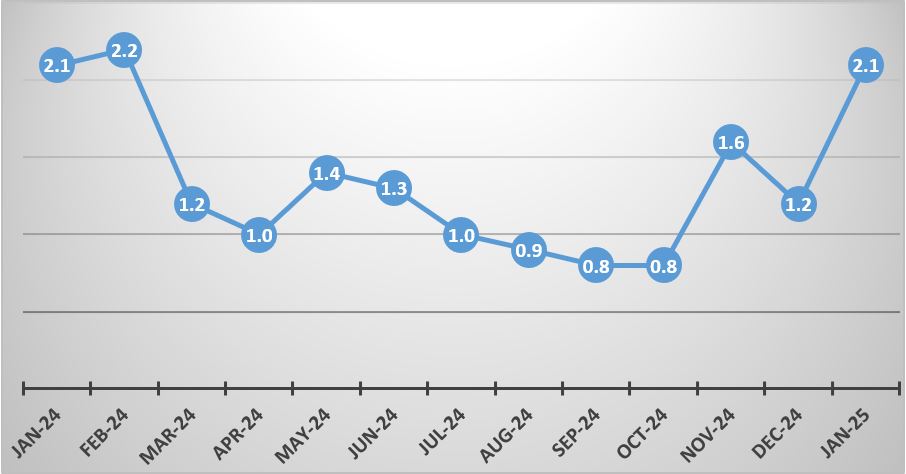
The overall monthly inflation for January 2025 was recorded at 2.1 percent compared with 1.2 percent recorded in the previous month. This outturn was mainly attributed to price movements in both food and non-food items (see Figure 3).
Figure 3: Overall Monthly Inflation, January 2024- January 2025
Monthly Inflation Rates for Food and Non-Food Items
Monthly food inflation rate for January 2025 was recorded at 2.8 percent Compared with the 1.4 percent recorded in December, 2024.This means on average prices of goods and services increased by 2.8 percent between December 2024 and January 2025. This development was mainly attributed to general price movements of Bread and Cereal (Maize Grain, Rice Local, Rice Imported, Bread, Wheat Plain Household Flour, Bread Flour Imported) Meat (Fillet Steak, Rump Steak, Brisket, Mixed Cut T-bone, Beef Sausage, Pork Chops, Goat Meat, Frozen Chicken); Fish (Frozen Fish, Buka Buka, Dried Bream-Medium Sized-Opened, Dried Kapenta Siavonga, Dried Kapenta Chisense); Cooking oil and Sugar.
Monthly non-food inflation rate for January 2025 was recorded at 1.0 percent compared with 0.9 percent recorded in December 2024. This means on average prices of nonfood items increased by 1.0 percent between December 2024 and January 2025. This was mainly attributed to increases in nonfood items such as Shoes and other footwear (Men Leather Shoes local, Men Shoes imported, Sports shoes, Ladies leather shoes, Boys and Girls School Shoes) Purchase of Vehicles(Toyota hilux, Toyota corolla, Nissan ALMERA 1.5 L Acenta MT, Nissan Pick (Nissan Hardbody)); Charcoal, Petrol, College fees, Primary and Secondary school fees private.
Table 5: Overall Monthly Inflation Rate for Food and Non-Food Items, January 2024- January 2025 (%)
| Weight: | Jan – 2024 | Feb – 2024 | Mar – 2024 | Apr – 2024 | May – 2024 | Jun – 2024 | Jul – 2024 | Aug – 2024 | Sep – 2024 | Oct – 2024 | Nov – 2024 | Dec – 2024 | Jan – 2025 |
Total | 1,000.00 | 2.1 | 2.2 | 1.2 | 1.0 | 1.4 | 1.3 | 1.0 | 0.9 | 0.8 | 0.8 | 1.6 | 1.2 | 2.1 |
Food | 534.85 | 2.3 | 2.3 | 2.4 | 1.0 | 1.3 | 1.5 | 1.5 | 1.0 | 0.8 | 0.9 | 0.9 | 1.4 | 2.8 |
Non- Food | 465.15 | 0.9 | 1.9 | 2.2 | -0.3 | 1.0 | 1.5 | 1.0 | 0.3 | 0.8 | 0.8 | 2.6 | 0.9 | 1.0 |