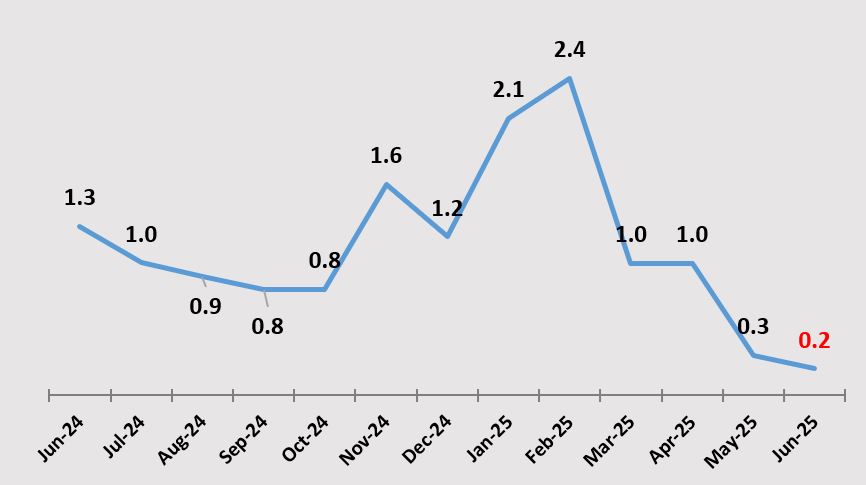
The overall monthly inflation for June 2025 was recorded at 0.2 percent from 0.3 percent recorded in the previous month. This outturn was mainly attributed to price movements in selected food and non-food items (see Figure 4).
Figure 4: Overall Monthly Inflation, June 2024-June 2025
Monthly Inflation Rates for Food and Non-Food Items
Monthly food inflation rate for June 2025 was recorded at 0.4 percent ccompared with the 0.6 percent recorded in May, 2025. This means on average prices of goods and services increased by 0.4 percent between May 2025 and June 2025. This development was mainly attributed to general price movements of Cereals (including breakfast mealie meal, roller mealie meal, maize grain, Samp, rice), Vegetables (such as Spinanch, Chinese Cabbage, Dried beans, Sweet potatoes) ; Fruits (like Oranges, Apples, Pineapples ); and Cooking oil.
Monthly non-food inflation rate for June 2025 was recorded at -0.2 percent compared with 0.0 percent recorded in May 2024. This means on average prices of non-food items decreased by 0.2 percent between May, 2025 and June, 2025. This outturn was mainly attributed to price movements in prices of non-food items such as Purchase of motor vehicles(Toyota hilux, Nissan Hardbody ) ; Passeger transport by air and Fuels(like Diesel, Petrol).
Table 7: Overall Monthly Inflation Rate for Food and Non-Food Items, June 2024-June 2025 (%)
| Weight: | Jun – 2024 | Jul – 2024 | Aug – 2024 | Sep – 2024 | Oct – 2024 | Nov – 2024 | Dec – 2024 | Jan – 2025 | Feb – 2025 | Mar – 2025 | Apr- 2025 | May- 2024 | June – 2025 |
Total | 1,000.00 | 1.3 | 1.0 | 0.9 | 0.8 | 0.8 | 1.6 | 1.2 | 2.1 | 2.4 | 1.0 | 1.0 | 0.3 | 0.2 |
Food | 534.85 | 1.5 | 1.5 | 1.0 | 0.8 | 0.9 | 0.9 | 1.4 | 2.8 | 3.4 | 1.0 | 0.8 | 0.6 | 0.4 |
Non- Food | 465.15 | 1.0 | 0.3 | 0.7 | 0.8 | 0.8 | 2.6 | 0.9 | 1.0 | 0.8 | 1.0 | 1.2 | 0.0 | -0.2 |