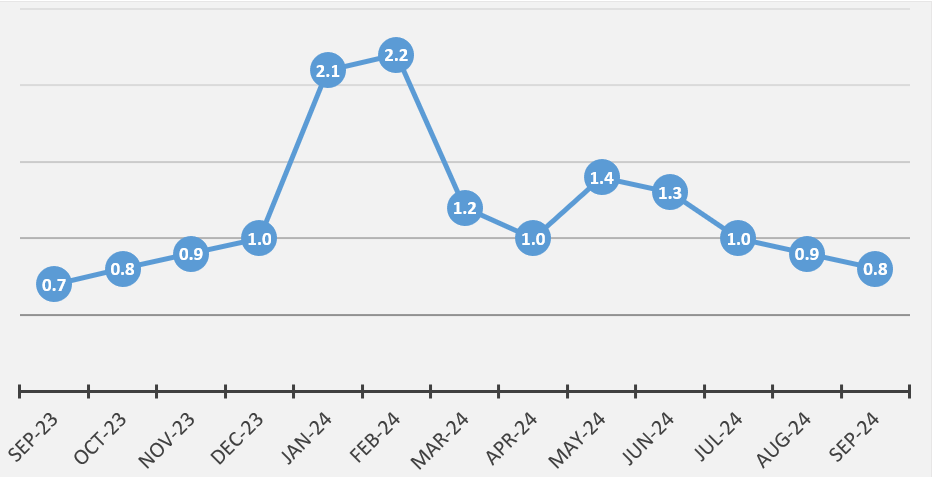
The overall monthly inflation for September 2024 was recorded at 0.8 percent from 0.9 percent recorded in the previous month. This outturn was mainly attributed to price movements in selected food items (see Figure 3).
Figure 3: Overall Monthly Inflation, September 2023- September 2024
Monthly food inflation rate for September 2024 was recorded at 0.8 percent compared with 1.0 percent recorded in August, 2024. This means on average prices of goods and services increased by 0.8 percent between August 2024 and September 2024. This development was mainly attributed to general price movements of Fish (Buka-Buka, Dried Bream-Medium Sized-Opened, Dried Kapenta Siavonga), Fruits (Apples, Pineapples, Pawpaw, Water Melon)Vegetables (Spinach, Chinese Cabbage, Cassava Leaves, Tomatoes, Green Beans, Eggplant).
Monthly non-food inflation rate for September 2024 was recorded at 0.8 percent compared with 0.7 percent recorded in August 2024. This means on average prices of non-food items increased by 0.8 percent between August 2024 and September 2024. This was mainly attributed to increases in non-food items such as Purchase of Motor Vehicles (Toyota hilux, Toyota corolla, Nissan ALMERA 1.5 L Acenta MT, Nissan Pick (Nissan Hardbody)); Passenger transport by air (Air Fare Domestic, Lusaka/London via Dubai) and Charcoal.
Table 5: Overall Monthly Inflation Rate for Food and Non-Food Items, September 2023- September 2024 (%)
| Weight: | Sep – 2023 | Oct – 2023 | Nov – 2023 | Dec – 2023 | Jan – 2024 | Feb – 2024 | Mar – 2024 | Apr – 2024 | May – 2024 | Jun – 2024 | Jul – 2024 | Aug – 2024 | Sep – 2024 |
Total | 1,000.00 | 0.7 | 0.8 | 0.9 | 1.0 | 2.1 | 2.2 | 1.2 | 1.0 | 1.4 | 1.3 | 1.0 | 0.9 | 0.8 |
Food | 534.85 | 0.5 | 0.7 | 0.9 | 1.0 | 2.3 | 2.3 | 2.4 | 1.0 | 1.3 | 1.5 | 1.5 | 1.0 | 0.8 |
Non- Food | 465.15 | 0.8 | 0.9 | 0.9 | 0.9 | 0.9 | 1.9 | 2.2 | -0.3 | 1.0 | 1.5 | 1.0 | 0.7 | 0.8 |
The Consumer Price Basket consists of 440 items which are spread across selected outlets in all the 116 districts of Zambia. Over 23,000 price quotations are collected from these outlets between the 1st and 10th of every month. The minimum and maximum prices for selected products by district are highlighted in Table 6.
Table 6: District Prices for Selected Products, September 2024
Product Description | Unit of Measure | Price (K) | Minimum | Price (K) | Maximum |
Location | Location | ||||
Breakfast Mealie Meal | 25 kg | 230.00 | Mongu | 400.00 | Chienge, |
Roller Mealie Meal | 25 kg | 190.00 | Mongu | 360.00 | Sioma |
Maize Grain | 20 litre tin | 100.00 | Muyombe | 260.00 | Kitwe |
Cooking Oil | 2.5 Litres | 115.00 | Lusaka, Katete | 175.00 | Chipata |
Eggs | Tray | 68.00 | Lusaka | 120.00 | Chilubi |
Sugar | 2 Kg | 55.00 | Lusaka | 90.00 | Chienge |
Charcoal | 50 kg bag | 45.00 | Chavuma | 375.00 | Lusaka |
Cement | 50 kg | 150.00 | Ndola | 200.00 | Chama |