The National Food Balance sheet for the 2025/2026 Agricultural Marketing season based on the crop forecasting survey shows that the country has produced sufficient maize for both human consumption and industrial use. The total maize supply is estimated at 4,040,645 metric tonnes, with national requirements of 3,539,024 metric tonnes. This results in a surplus of 501,621 metric tonnes.
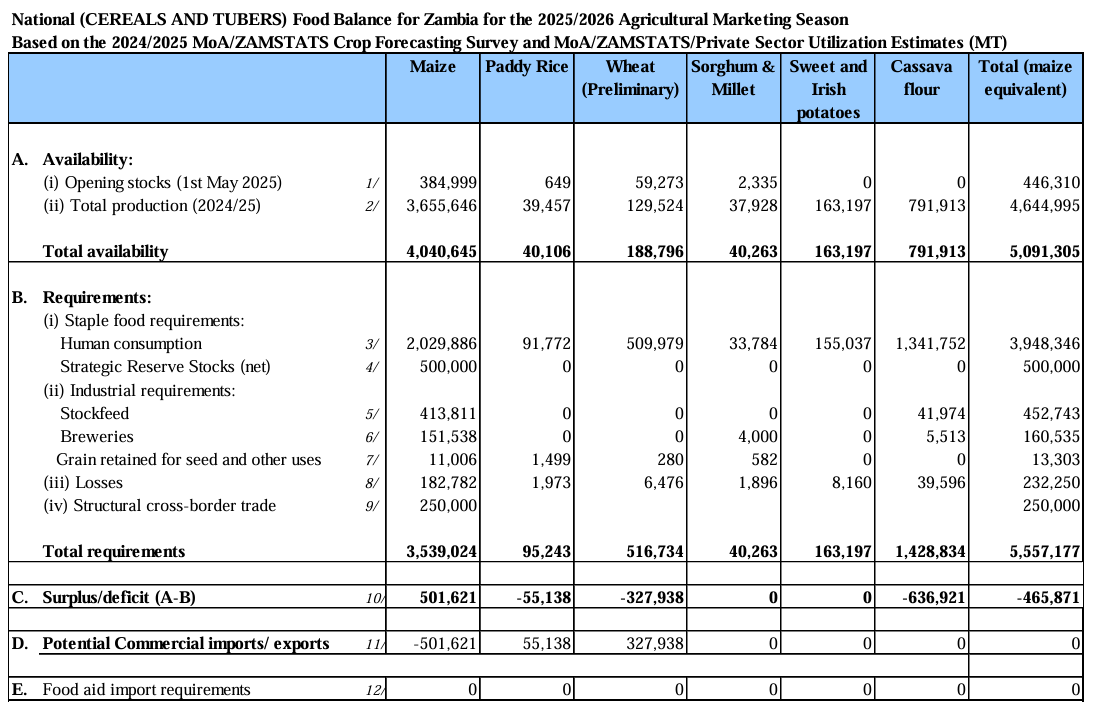
Source: ZamStats , 2025
NOTES:
1/ Stocks held by commodity traders, millers, brewers, FRA and commercial and small scale farmers as at 1st May 2025
2/ Production estimates by MOA/ZAMSTATS. Cassava production is based on the total area under cassava, using an annual yield figure of 11.7 tonnes per hectare (MAFF Root and Tuber Improvement Programme, 1996). A flour extraction rate of 25% is used.
3/ Human staple food consumption represents 70% (1,470 kCal/person/day, ZAMSTATS) of total diet (2,100 kCal/person/day, National Food and Nutrition Commision), for the national population of 22.66 million people (based on ZAMSTATS Census projections with 2025 and 2026 average population used).
The food balance shows an overall deficit of staple foods. Food prices may affect the level of food consumption.
4/ National strategic requirements expected to be carried over into the next season by FRA. (this amount of 500,000 Mt includes equivalent to 3 months cover)
5/ Estimated requirements by major stockfeed producers.
6/ Estimated requirements by industrial breweries.
7/ Estimated retention of grain for other uses by smallholders.
8/ Post harvest losses are estimated at 5% for grains, sweet potatoes and cassava, in line with estimates from other SADC countries.
9/ Structural exports represents cross-border trade, mostly to the DRC and Malawi that occurs on a continuing basis and that is likely to occur during the 2025/26 marketing season. It does not include formal trade.
10/ Expected surplusses or deficits that arise after meeting minimum overall staple human consumption requirements as well as industrial requirements.
The total surplus/deficit is expressed as maize equivalent using energy values.
The rice deficit is based on a 3 year rolling average of what is known to be imported each year, as indicated under D.
11/ Commercial imports/exports represent expected regional and international trade by the private sector. For cassava, the deficit represents cassava that is still in the ground and may not necessarily be harvested.
12/ Total estimated requirement for food relief among vulnerable groups, to be imported. This could be met with maize or other grains.